We publish the horizons where we lose.
We test our models at the distance ahead you tell us you need, and compare them with the simplest possible guess: “nothing will change”. A model that cannot beat that guess is refused, and the refusal is recorded.
In plain termsA fair test, an honest baseline, and the failures published.
At a glance
Horizon first
Declared by the business before anything is trained.
Persistence is the null
Not our previous release.
Per-horizon, never averaged
The shape of the curve is the information.
Failure is in the record
Failed and not measured are never passes.
Why the obvious evaluation is wrong
Three defects in conventional model reporting.
The horizon is chosen after the fact
If you can pick the horizon at which your model looks best, you have not measured anything. Deployment happens at the horizon the business needs, which is why we take that as an input before training.
The baseline is another version of the model
“15% better than our previous release” is a statement about our release cadence, not about whether the thing is useful. The question a buyer should ask is: is this better than assuming nothing changes?
Failure is missing
A model report with no failure modes is a brochure. It cannot be taken to a validation committee, and it hides the case where the platform is wrong for your domain.
The baseline: persistence, and why it is the honest null
The persistence baseline predicts: the next state looks like the current state. It needs no model, no data and no training. It is also genuinely hard to beat in many operational settings, because operational state is autocorrelated: tomorrow usually does look like today.
That is the point. If we cannot beat it, we are adding operational complexity and no information, and you should know that before you buy rather than after you deploy. We report the ratio of model error to baseline error, per horizon, so you see the shape rather than an average.
Per-horizon reporting: the shape of the curve is the information
A single accuracy number hides what matters most: how far ahead the model is still useful. We report error at several horizons (for example 1, 5 and 20 steps ahead, where a step is one update of the model) and record the error at each, the baseline error at the same horizon, whether the model beats it, and the furthest horizon at which it still does.
| Outcome | Meaning |
|---|---|
| Passed | Beat the baseline at that horizon |
| Failed | Did not beat the baseline at that horizon |
| Not measured | That horizon was never evaluated |
Collapsing “not measured” into “passed” is the most common way model reporting lies by omission. Our gate refuses to do it: an unmeasured declared horizon produces a warning, not a silent pass.
Model report card · illustrative shape, not a measured result
- 1 stepPassed
- 5 stepsPassed
- 20 stepsFailed
- 50 stepsThis horizon was never evaluatedNot measured
Divergence: bad is not the same as broken
A model can be inaccurate, and a model can be degenerate, producing non-finite or pathological output. They need different responses (“more data” versus “your feed is broken”), so they are different verdicts with different messages.
There is a specific trap here: every comparison involving a non-finite value is false. A naive “error is worse than baseline” test therefore returns false for a diverged model, which means a diverged model can pass a performance gate. We test for divergence first, explicitly, for exactly this reason. It is the kind of defect that ships silently in systems that only test the happy path.
Corpus provenance: what trained this model, and did it teach itself?
We record which teacher produced every training row. This exists because of a failure mode that is invisible to performance testing: a model trained on data a previous model generated will score excellently and know nothing. It is a closed loop, and every metric improves as it tightens.
What the platform tracks and reports:
- the teacher attributed to each training row
- how many rows are unattributed (older data, unknown origin)
- whether the corpus has a single named teacher or many
- a disqualification verdict when the corpus is too self-referential to certify
This is the first check in the gate, ahead of every performance question, because a self-referential model passes every performance check there is.
The promotion gate: order of refusal
| Order | Check | Refusal means |
|---|---|---|
| 1 | Corpus provenance | Training data is not attributable, or too self-referential to certify |
| 2 | Divergence | Output is degenerate, not merely inaccurate |
| 3 | Beats the persistence baseline | The model is not adding information at the reported horizons |
| 4 | Declared horizon measured | The horizon the business requires was never evaluated |
Default posture: refuse. Automatic promotion requires passing every check. Manual promotion is possible, and every override is recorded with its actor and reason. Using a model that failed its gate is a decision someone owns by name.
The promotion gate refuses in a fixed order
- 1 · Corpus provenance
- 2 · Divergence
- 3 · Beats persistence
- 4 · Declared horizon measured
- Serve
The default posture is to refuse. A human can override, and the override is recorded with the actor and the reason.
What we do not claim
What to ask us
These are the questions that separate the platform from a demo.
- Show me the model record. Which horizons does it beat persistence at?
- Which horizons did you not measure, and why?
- What is the corpus provenance? How much of the training data is unattributed?
- Show me a refused promotion and the reason recorded.
- What is the furthest horizon you would stand behind for my domain, on my data?
We will answer all five in a technical session, on your data.
What the comparison looks like in the product
Each model against the dashed baseline: below it, the model adds information; above it, it does not.
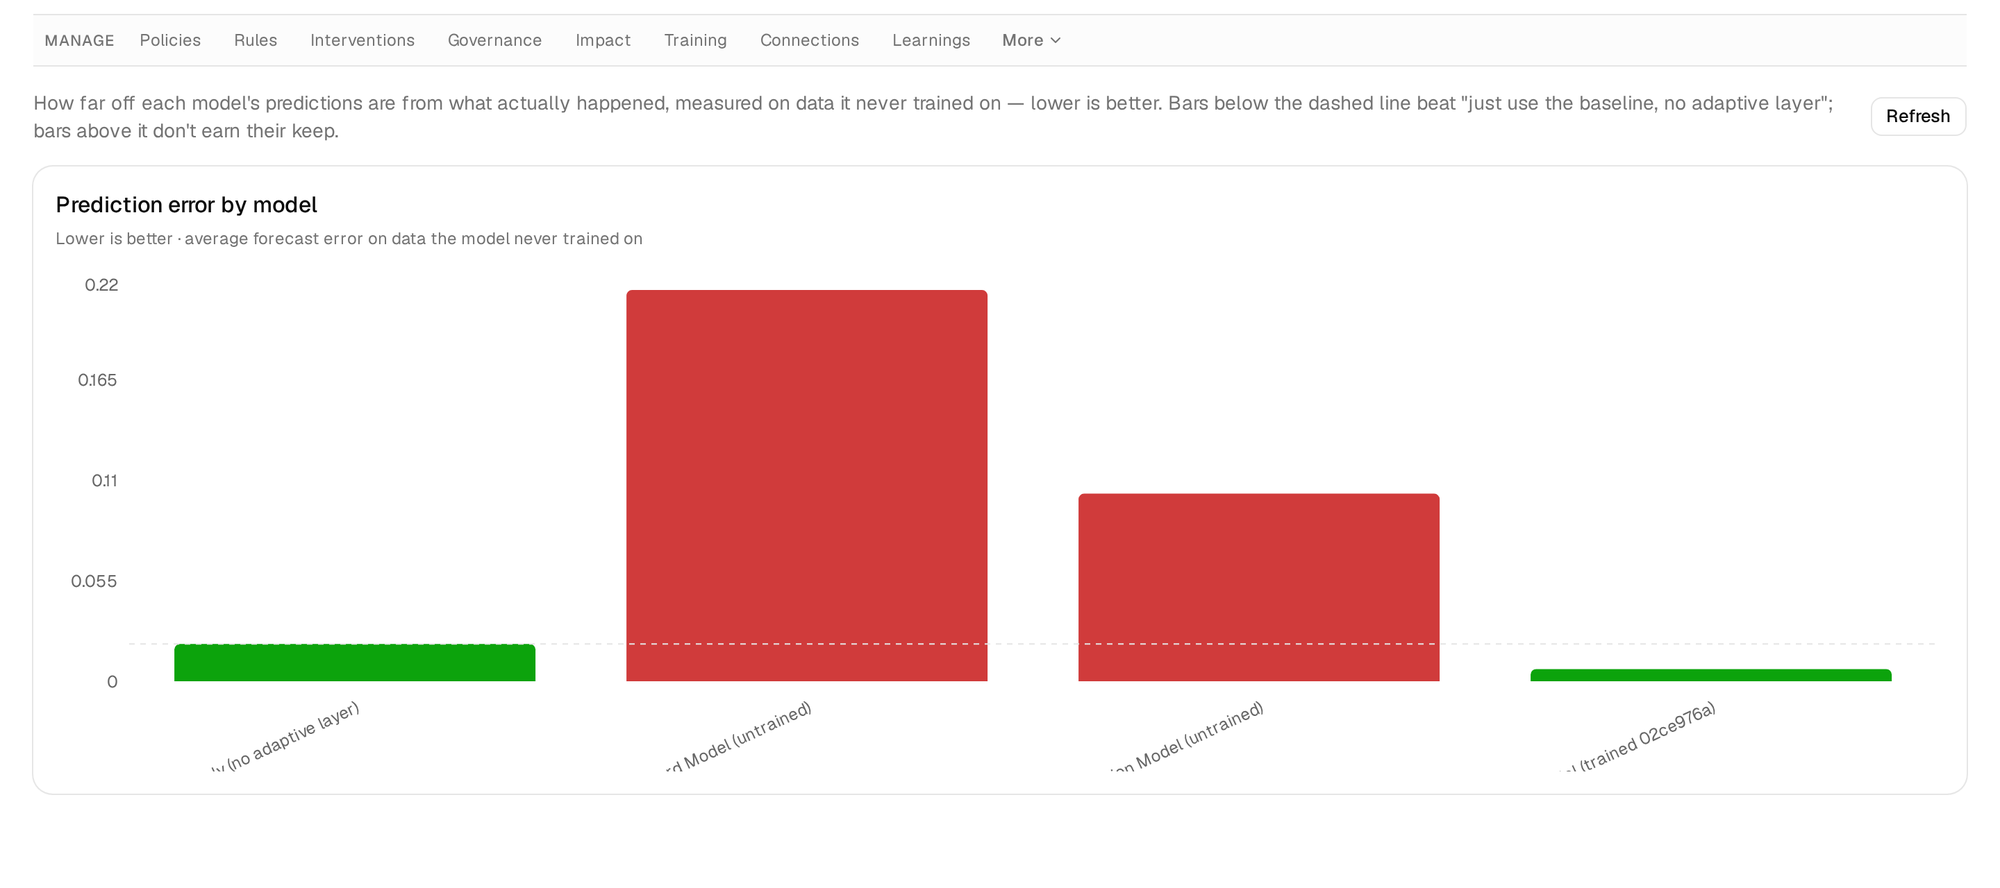 Fictional reference world: OgMart
Run the five questions on your data
A sample of real events is enough to read a model record, including the horizons where it loses.